
Over time
Compare months and find changes in spending.
The receipts you already keep become spending by month, category and supplier. No spreadsheet to rebuild.
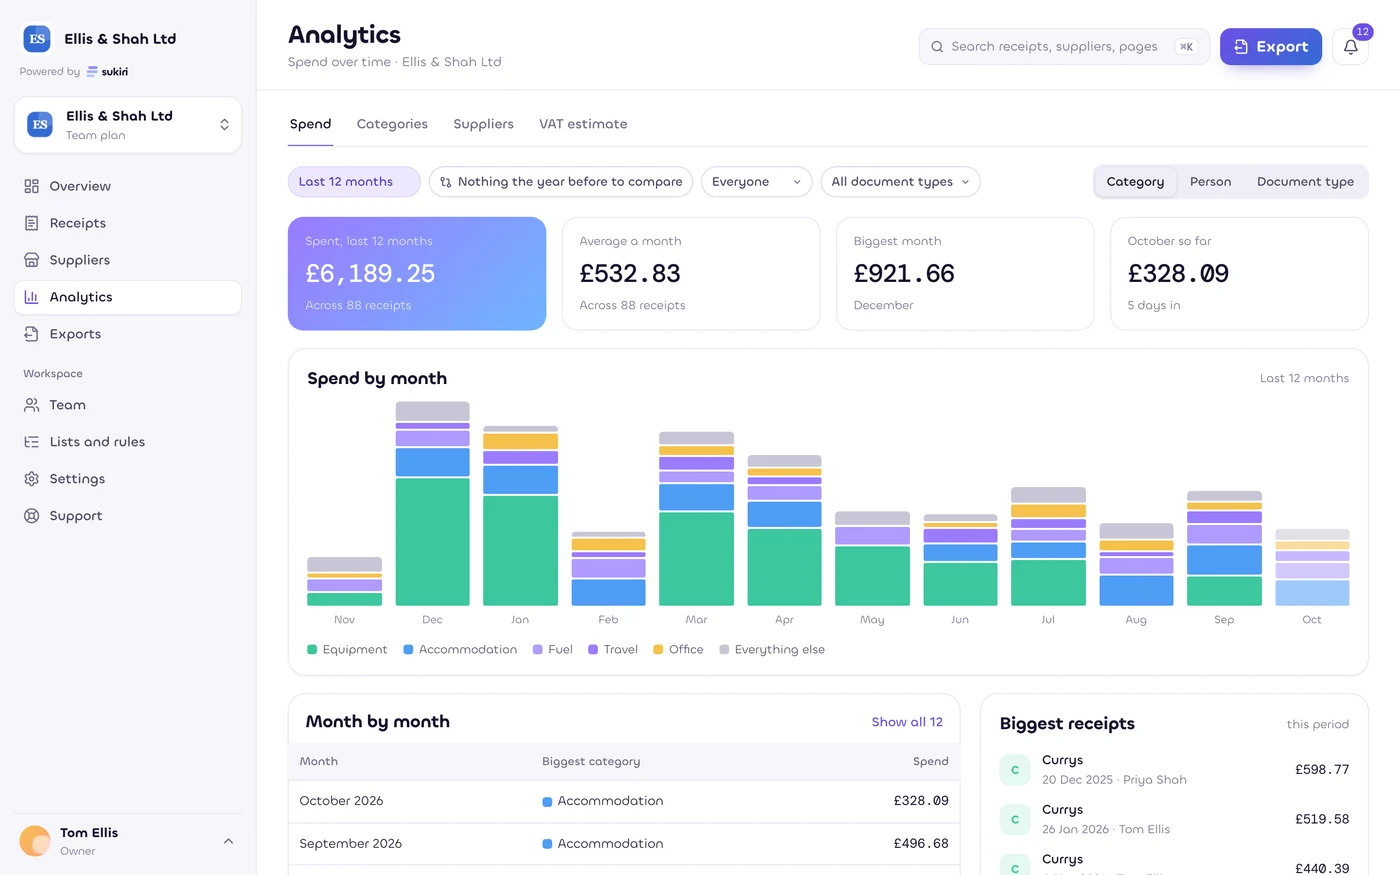
Start with the full history in your personal workspace. Team and practice views follow the receipts each person is allowed to see.
Compare months and find changes in spending.
See travel, food, equipment and your own categories.
Find the businesses you spend with most.
See discounts and vouchers found on your receipts.
Team views bring permitted receipts together.
Deeper item analysis is planned with Enrich.
The report adds up VAT read from your receipts. It does not decide whether you may reclaim it. Check the receipts and your circumstances with your accountant.
Document type, receipt category, item category and tax treatment describe different things. A category does not decide tax treatment.
The design calls for anonymised groups of at least 20 workspaces and a choice to opt out. Benchmarks are a later Enrich feature, not a live comparison on this site.
Estimates only, as at 5 October 2026. Not tax, legal or financial advice. Rules change. Check with your accountant.
Start with your free personal workspace.
Add your team when you need it.